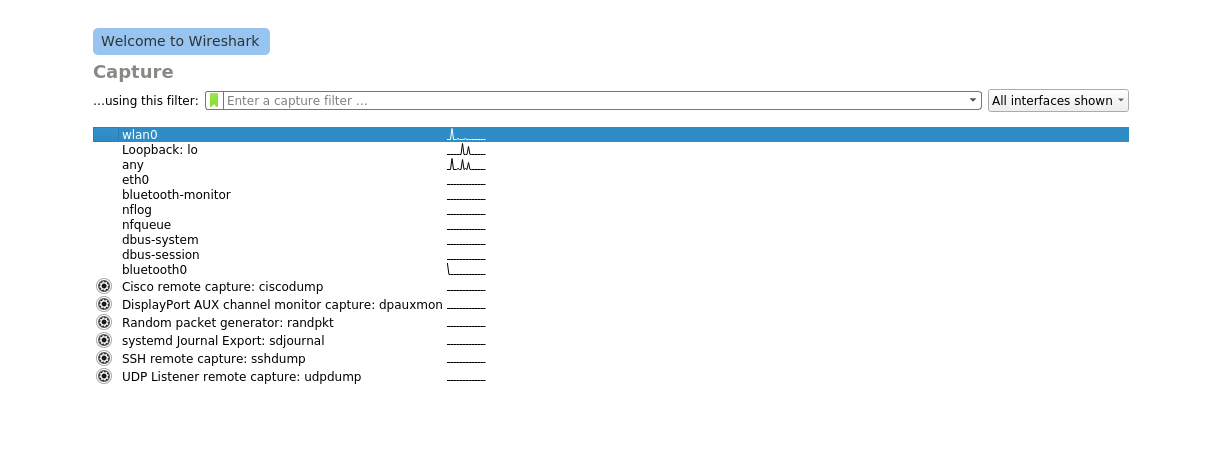
Wireshark proved to be one of most powerful network package capturing and analysis tool. Download is pretty much easy and given the link here. Once you fire up Wireshark it’ll look like this,

There are lot of interfaces supported such as loopback, ethernet(eth0), bluetooth and so on.
We will look wlan0 now, which captures the network packets from wireless communications.
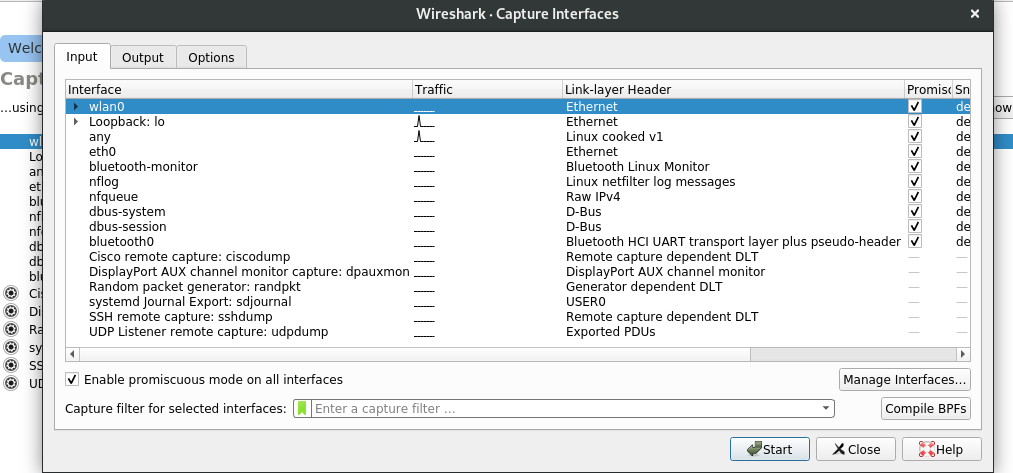
Enter Capture options screen(Ctrl+K or Click the gear icon). Select Enable promiscuous mode on all interfaces at the bottom.
This option would put your NIC to capture all packets received in the network that you are connected to.
Also, we can configure Output and Options which fine tunes the way of capturing the data in a file(pcap or pcapng) as per our need.

Click Start and your NIC will start to receive all packets in your network. As a beginner it’ll be real hard to decode what’s happening in wireshark once capturing is started(my current phase too!).
I have tried to explain here with a simple example. Make sure no other application or any site that transfers network packets are active, so that it’ll be easy for us to narrow down the traces.
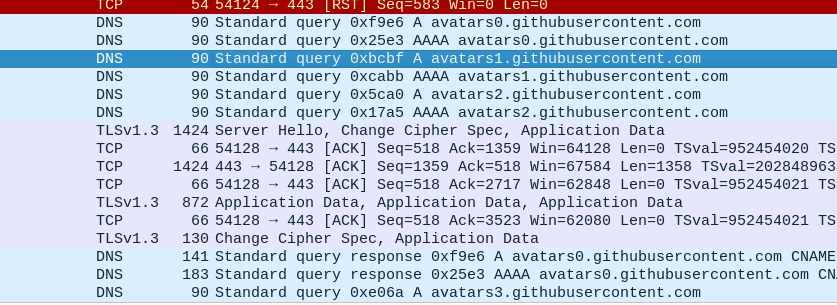
You’ll find lot of DNS, ARP, ICMPv4/v6 traces in wireshark once capturing has started. Now load your browser and surf any site of your choice. I’ve done it with github.

So in traces you can see the request went to github site and response is also received. On clicking on particular trace, we can debug what data packets were transmitted and received. Anyhow, this would be different in case of secured sites-means some tough effort would be needed to get the exact data needed.
Once you have located the site URL or the IP address, you can filter out the communication to that particular site with Wireshark filter sets like ip.addr == xxx. Or you can right click on the trace and give Follow TCP which filters and tracks TCP communications done with that address.
##Tips:
-
You can visualize the traces as a flow graph or to be precise like a HSM charts. For this Navigate to
Statistics->Flowgraphnow Wireshark will present you a flowgraph of all communications done. -
Previously we have tracked down the site name in wireshark traces. It would be tough to track that everytime in a live capture traces. To ease this up, wireshark provides an option. Navigate to
View->Name resolutionand enableResolve Network address. Now you could see some of the IP addresses were replaced with site name. We can edit these resolved names as per our convenience too.

If your network traffic is not enough for learning, wireshark has repo of sample traces which you can download and analyse on your own.
Thats all for now. Hope these tips would be of some help. If you are well versed with network protocols it would be quite easier. Probably, we can get a good tuts on these protocols in the internet. I’ll try to cover some major ones in future.
If you find this helpful, please like and share. Comment any corrections or information so that all can learn!
Cheers!!!
 grim
grim 
 Troubleshoot-Cannot run VLC as root